
New research identifies the immune cells that travel from skin to joints and why they trigger disease in some patients (Figure 1).

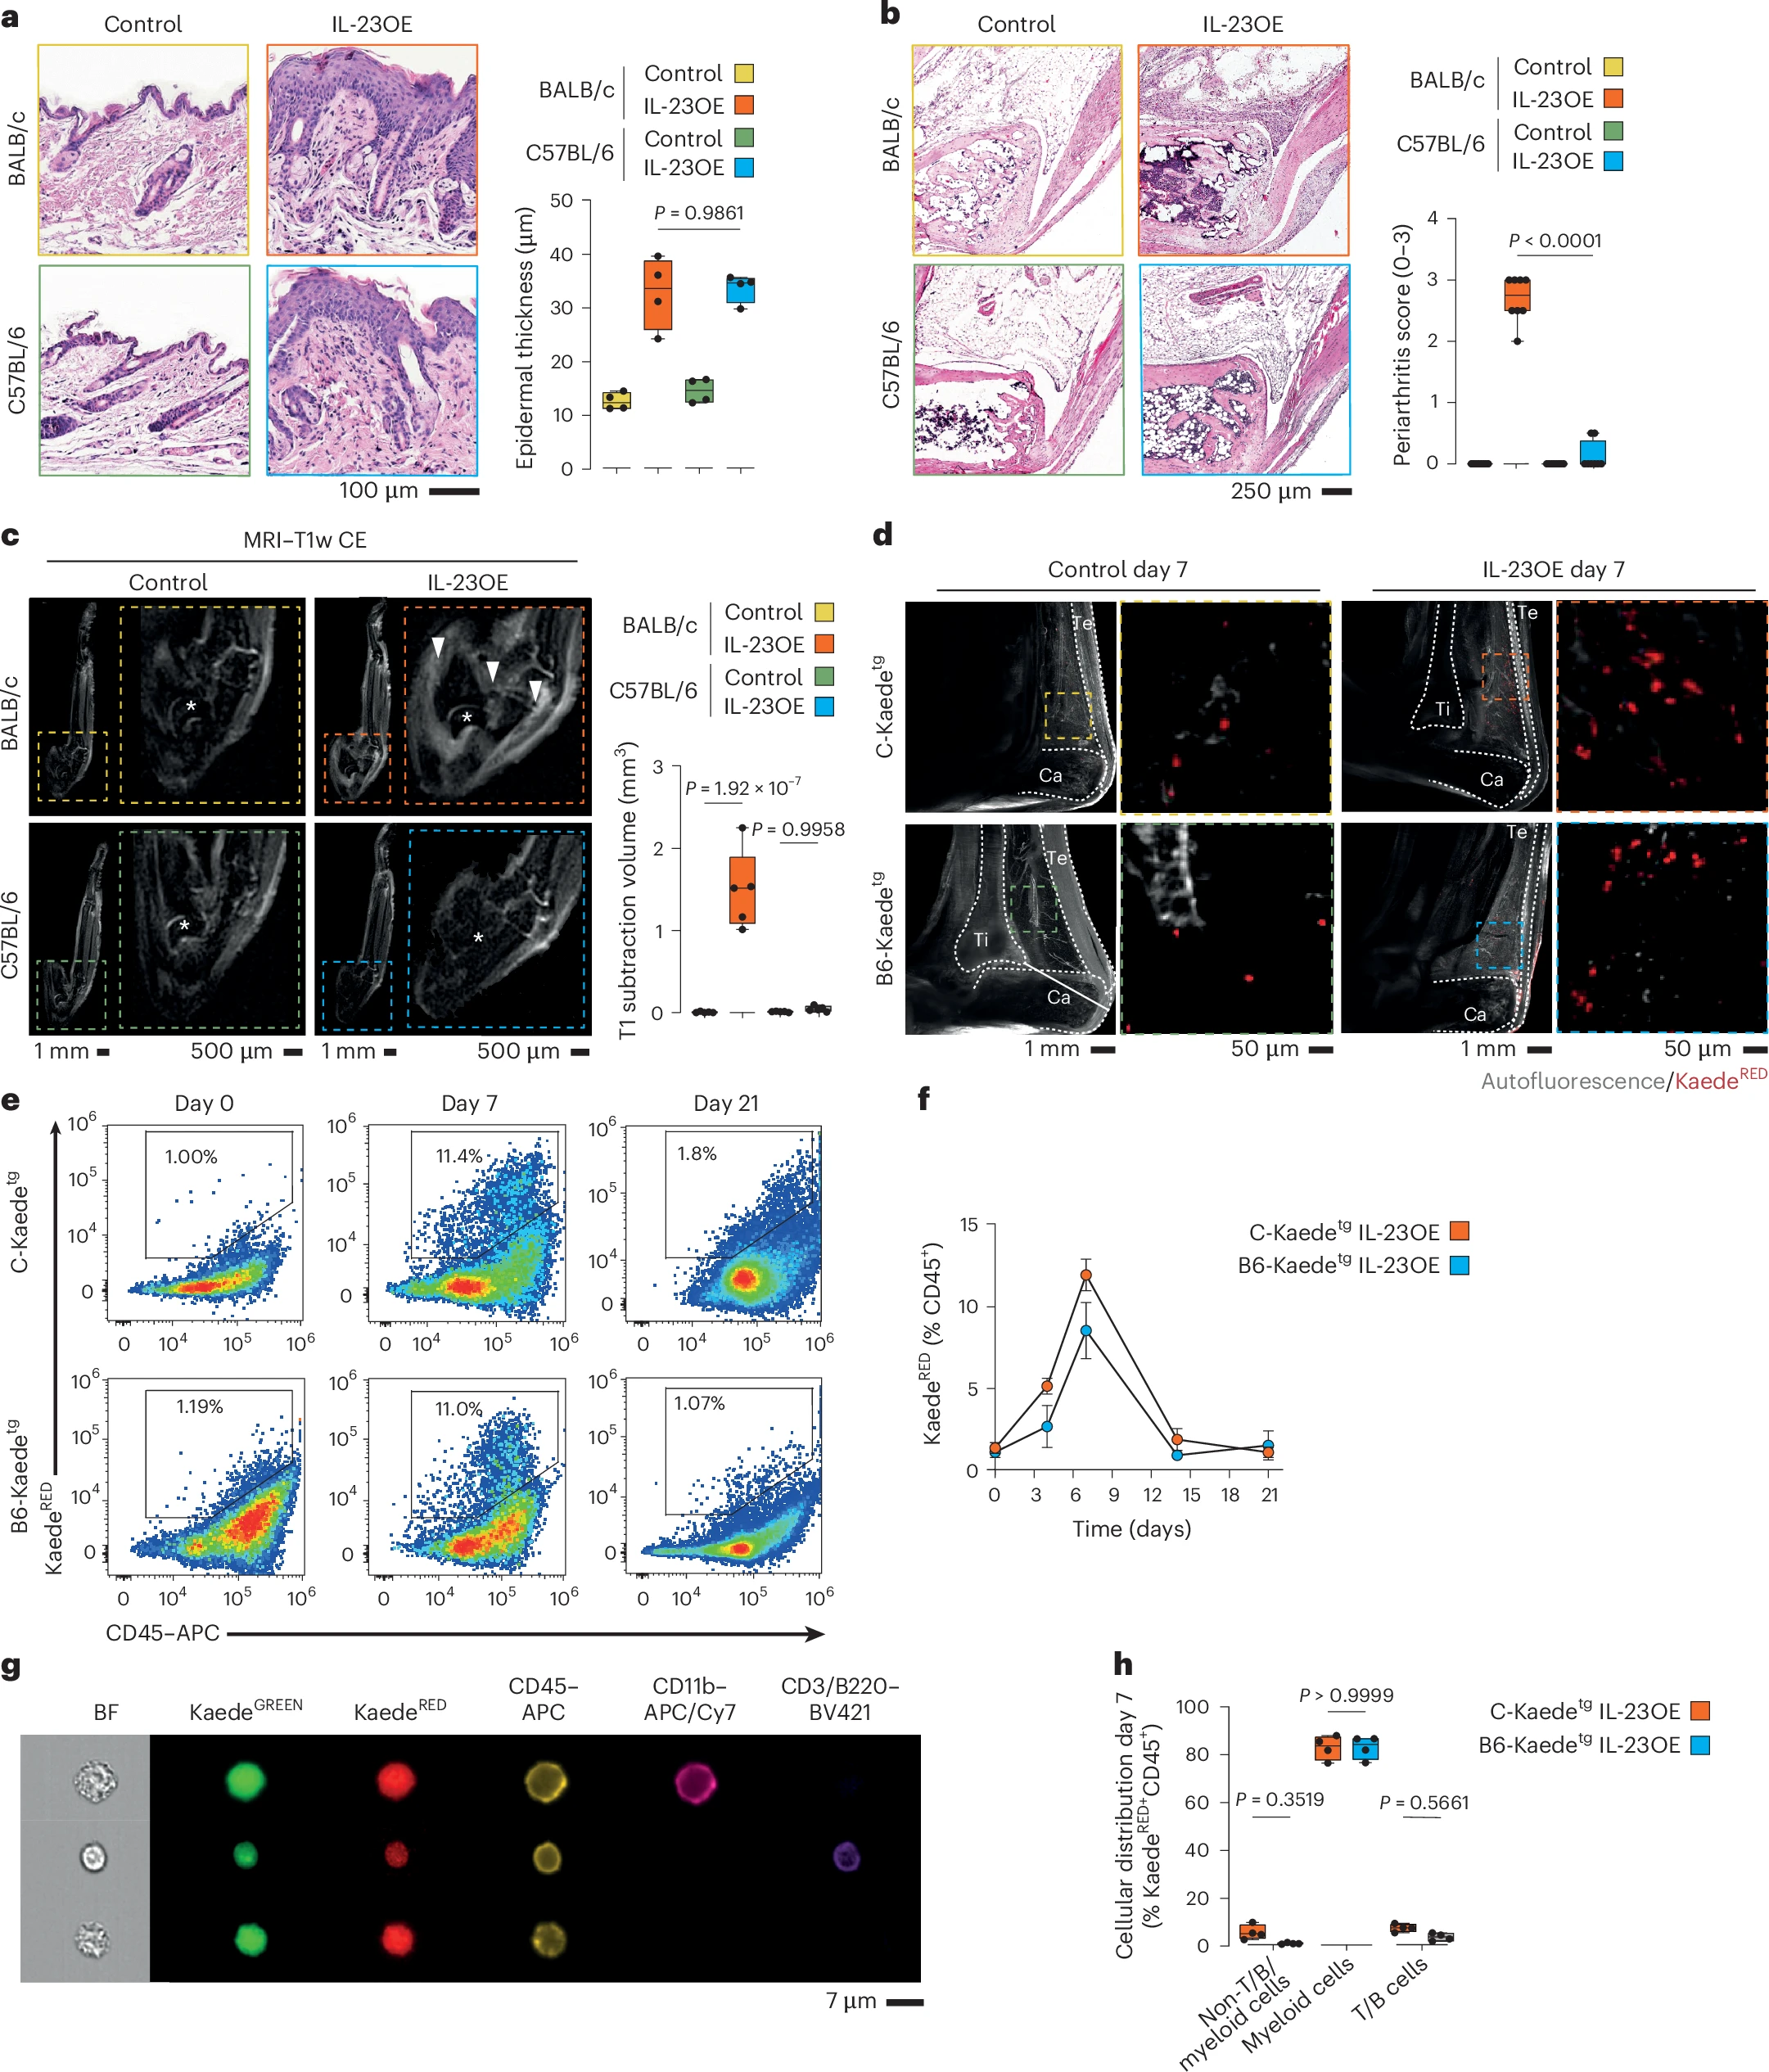
Figure 1: CD11b+ myeloid cells migrate from the skin to joints in a model of psoriatic disease. a, Left, representative micrographs of H&E-stained skin sections of the hind paws of BALB/c and C57BL/6 mice at day 21 with and without IL-23OE. Right, quantification of epidermal thickness at day 21. The graph shows the median, quartiles and minimum–maximum; N = 4 per condition. P values were calculated by one-way analysis of variance (ANOVA) with a Tukey’s post hoc test. b, Left, representative micrographs of H&E-stained ankle sections of BALB/c and C57BL/6 mice at day 21 with and without IL-23OE. Right, quantification of arthritis at day 21. The graph shows the median, quartiles and minimum–maximum; N = 8 per condition. P values were calculated by one-way ANOVA with a Tukey’s post hoc test. c, Representative micrographs of MRI-scanned ankles of BALB/c and C57BL/6 mice at day 21 with and without IL-23OE used for the quantification of arthritis at day 21. Arrowheads indicate inflammation, and stars indicate the talar bone. The graph shows the median, quartiles and minimum–maximum; N = 5 per condition. P values were calculated by one-way ANOVA with a Tukey’s post hoc test; T1w CE, T1-weighted contrast-enhanced. d, Representative micrographs of light sheet fluorescence microscopy of Kaedetg ankles from BALB/c (C-Kaedetg) and C57BL/6 (B6-Kaedetg) background strains at day 7 with and without IL-23OE and after photoconversion of cells localized in the skin. Arrowheads indicate accumulations of photoconverted KaedeRED cells. Graphical drawings of the tibia (Ti), calcaneus (Ca) and Achilles tendon (Te) are included. e, Representative flow cytometry plots for the quantification of KaedeRED skin-derived cells in the joint. f, Quantification of KaedeRED skin-derived cells in the joints. The graph shows the mean and standard error of the mean; N = 4 per time point and condition. g, Representative micrographs of imaging flow cytometry for the typing of KaedeRED skin-derived cells in the joint at day 7; BF, brightfield. h, Quantification of CD45+ KaedeRED skin-derived cell types in the joints at day 7. The graph shows medians, quartiles and minimum–maximum; N = 4 per condition. P values were calculated by one-way ANOVA with a Tukey’s post hoc test.
- Exit inflamed skin
- Enter the bloodstream
- Migrate onward to the joints
- Incoming immune cells are no longer effectively controlled
- Inflammatory signals escalate
- Sustained joint inflammation is triggered
- Identifying patients at high risk of psoriatic arthritis early
- Monitoring disease progression before irreversible joint damage occurs
- Developing preventive therapies that intercept these immune cells or restore fibroblast function