

A comprehensive single-cell atlas reveals how tissue environment and time shape eosinophil identity across the body (Figure 1).
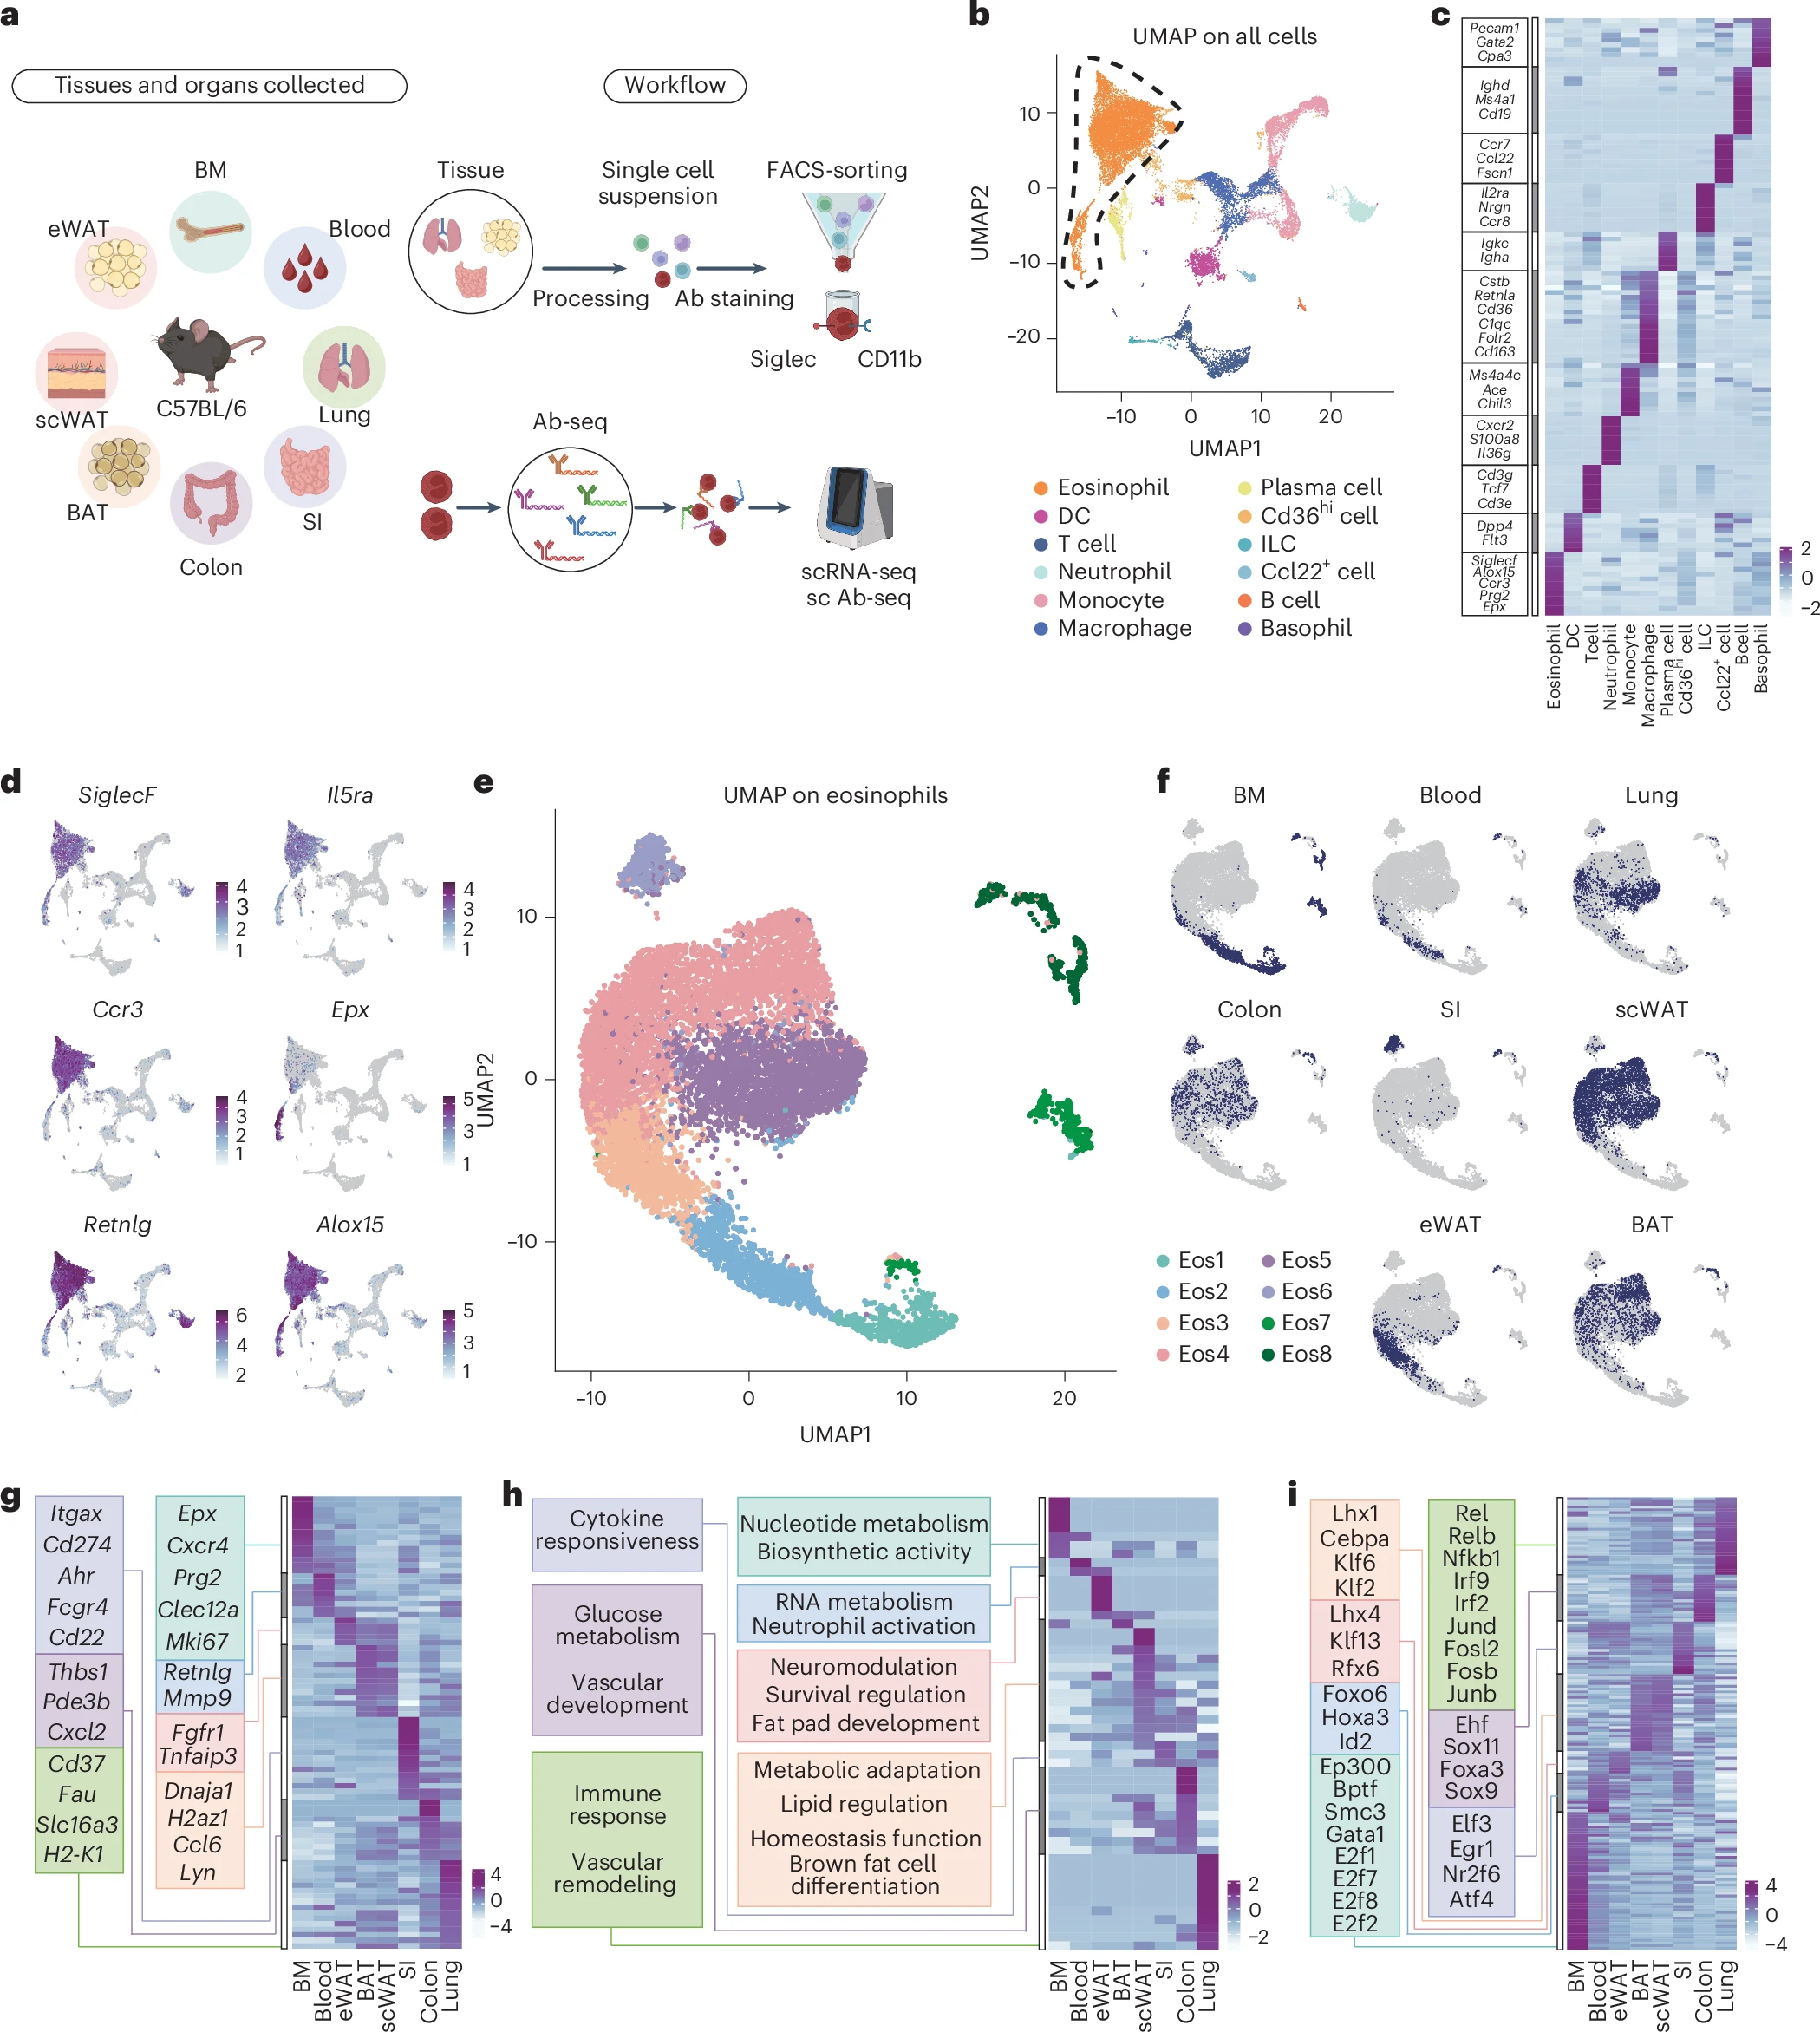
Figure 1: Single-cell transcriptomics analysis identifies tissue-specific eosinophil states. a, Schematic diagram of tissue processing, single-cell sequencing and antibody sequencing workflow. b, Integrated UMAP of all tissues with cell type annotations. DC, dendritic cell; ILC, innate lymphoid cell. c, Heatmap of DEGs across all cell populations. d, Expression of eosinophil marker genes. e, UMAP of eosinophil transcriptomes obtained from the BM, blood, lungs, colon, SI, scWAT, eWAT and BAT of C57BL/6 mice. f, Distribution of tissue origins projected on UMAP. g, Heatmap displaying tissue-specific DEG patterns. h, Tissue-originated pathway enrichment analysis shown by heatmap. i, TF regulatory network heatmap from SCENIC analysis across tissues (showing TF activation).
- Single-cell RNA sequencing (to measure gene expression),
- High-dimensional surface proteomics (to profile cell-surface markers), and
- In vivo fate mapping (to track eosinophil lifespan and movement),
- In the small intestine, eosinophils are long-lived and diversify into multiple transcriptionally and phenotypically distinct subsets.
- In contrast, eosinophils in the lungs (short-lived) and colon (intermediate-lived) remain relatively uniform, showing far less specialization.
- Tissue-specific signals provide contextual instruction, and
- Duration of residency determines the depth of eosinophil maturation and specialization.
- More precise disease models,
- Better interpretation of eosinophil-targeted therapies, and
- Identification of tissue- and state-specific therapeutic targets.