

New research uncovers how tumours use TGF-β to build a powerful double barrier against the immune system and how it might be dismantled (Figure 1).
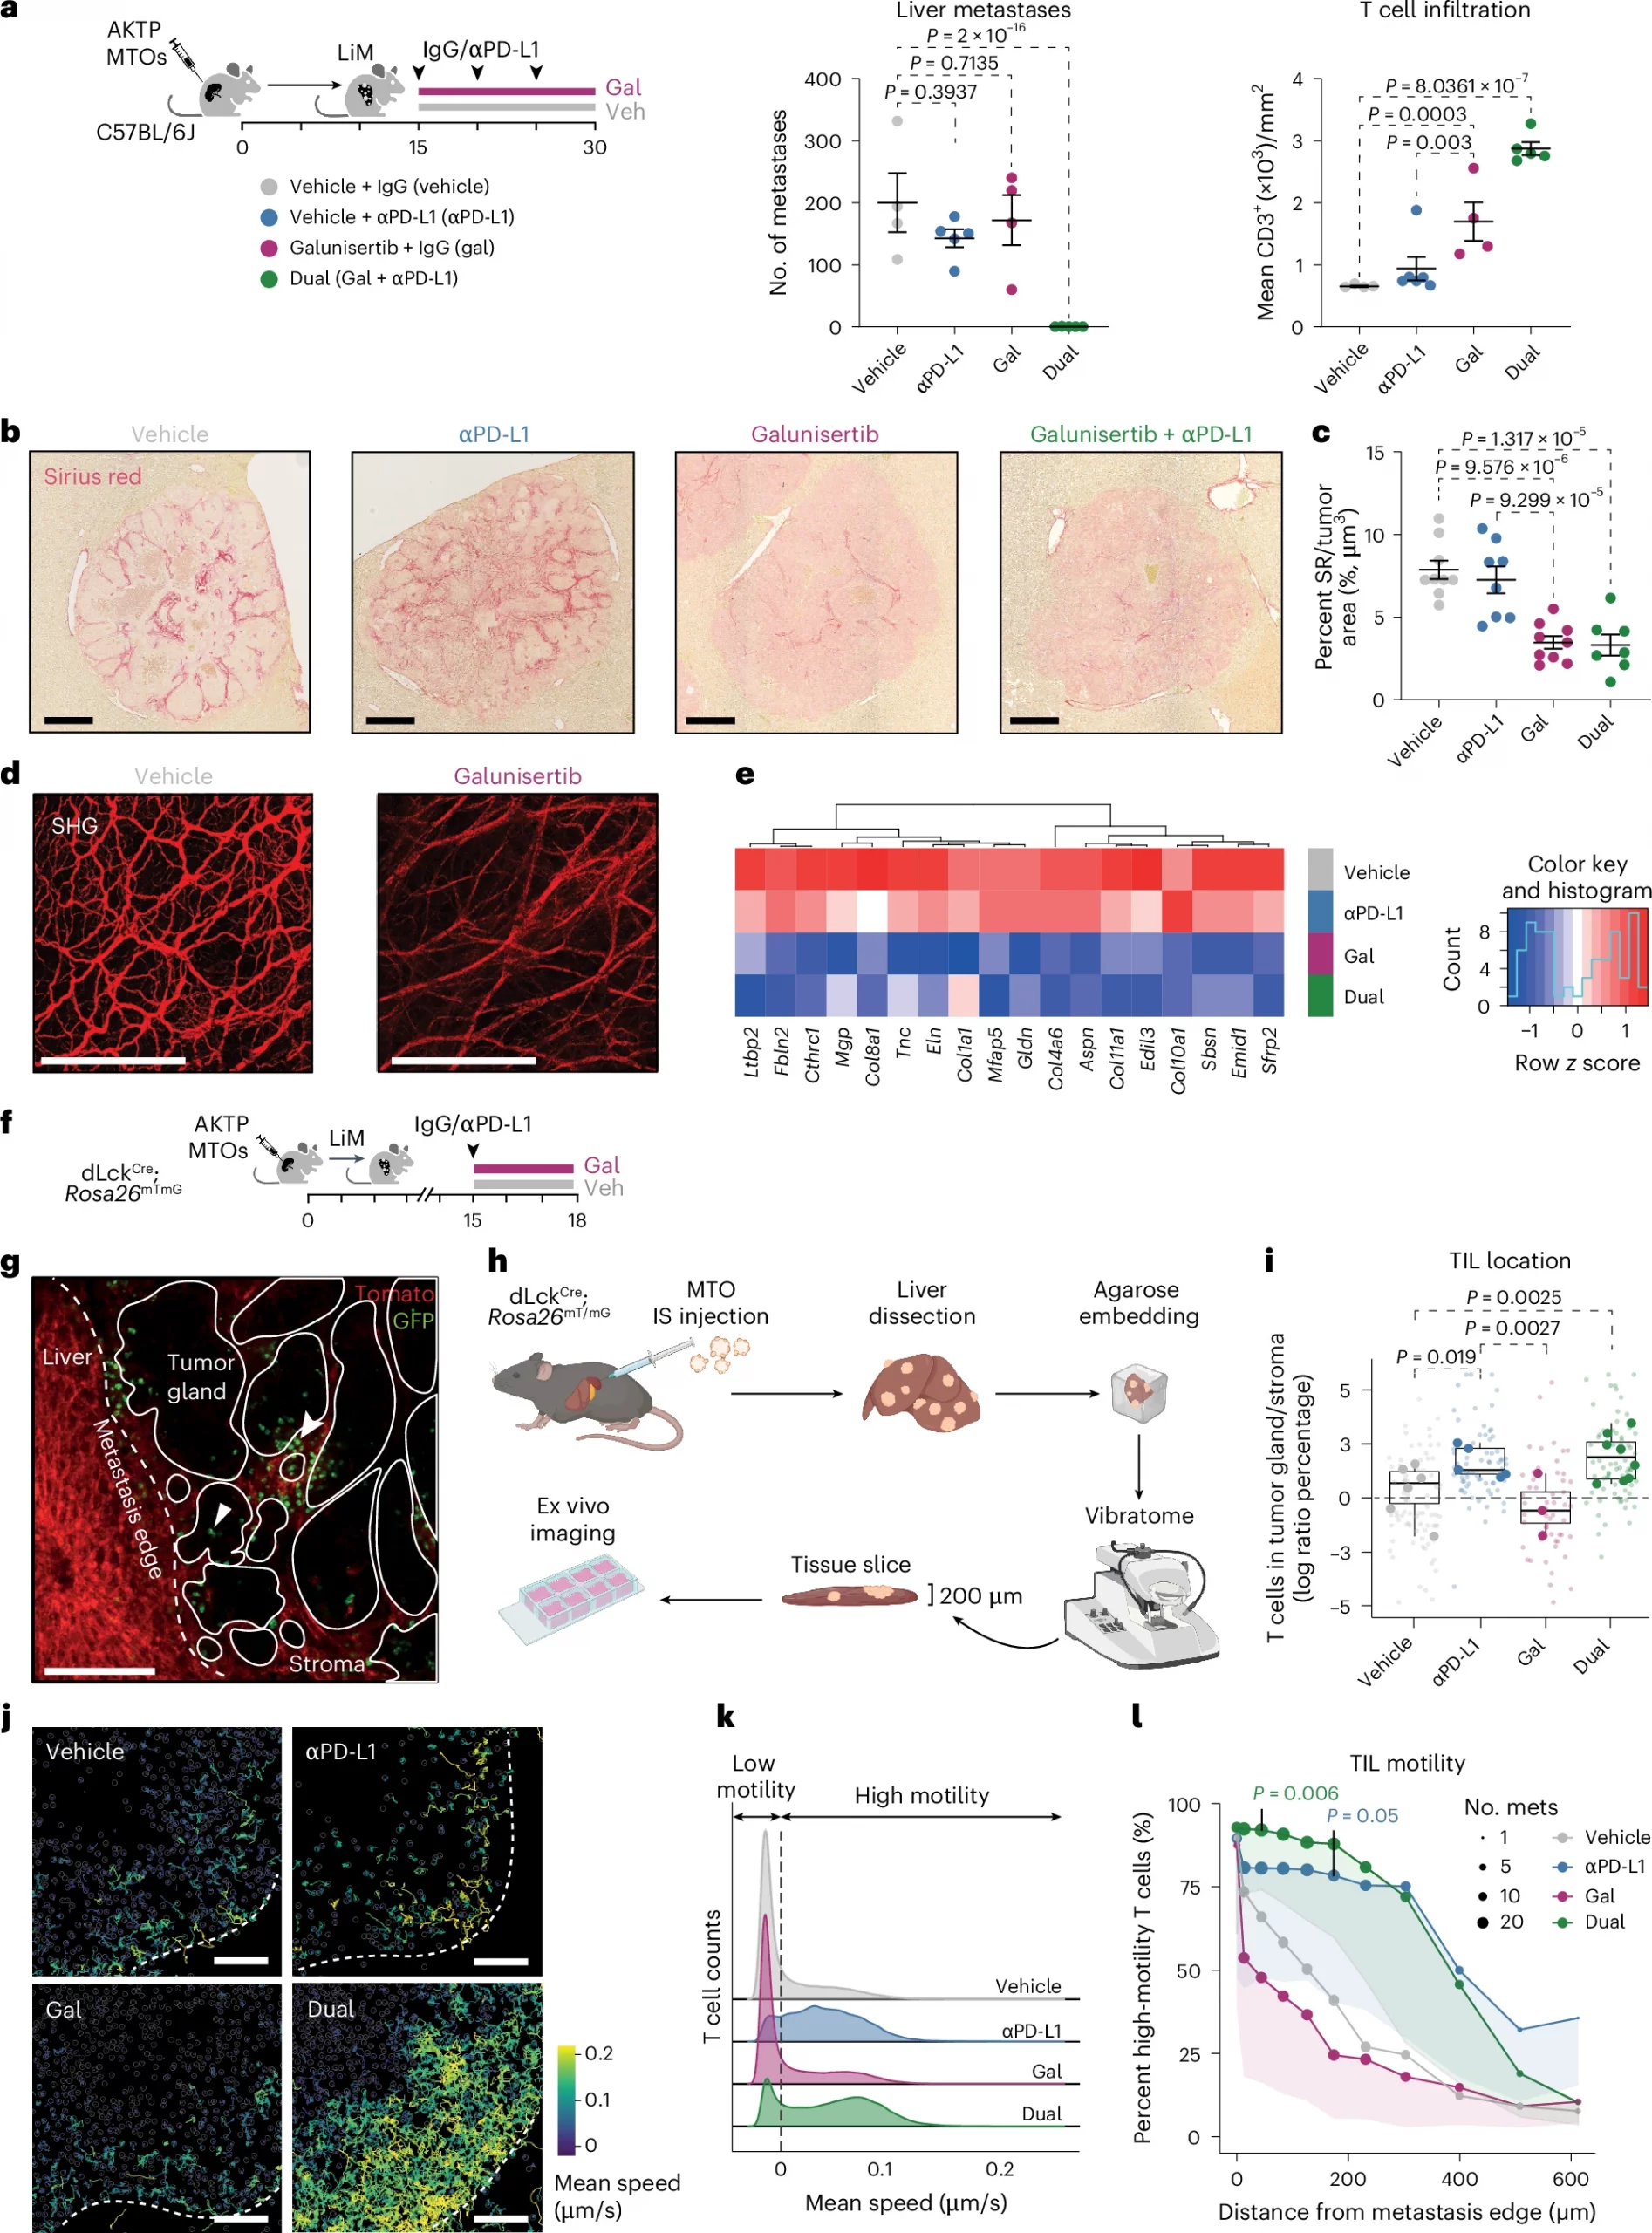
Figure 1: Inhibition of T cell motility by PD-1–PD-L1 interactions but not by TGF-β signaling. a, Therapeutic interventions were initiated on day 15 after intrasplenic (IS) injection of AKTP MTOs to establish liver metastases (LiMs) in C57BL/6J mice (Tx, treatment 15 d). Quantification of liver metastasis number (left) and CD3+ T cell densities (cells per mm2) assessed by immunohistochemistry (right). Mice per group: vehicle (Veh), n = 4; anti-(α)PD-L1 therapy, n = 5; galunisertib (Gal), n = 4; dual therapy, n = 5. Mean ± s.e.m. b,c, Collagen deposition in liver metastases after 3 d of treatment was evaluated by Picrosirius red staining. b,c, Representative images (b) and quantification per area (c). Mice per group: vehicle, n = 9; anti-PD-L1 therapy, n = 8; galunisertib, n = 9; dual therapy, n = 8. Mean ± s.e.m. SR, Sirius red. d, Representative SHG imaging of collagen fibers in liver metastases, shown as a maximum intensity projection of a 100-μm z stack (1-μm intervals). Experiments included at least three animals and were independently replicated three times. Scale bars, 100 µm. e, Bulk RNA-seq analysis of ECM-related gene expression in metastases after 3 d of treatment (n = 3 mice per group). f, Schematic of acute in vivo treatment (3 d) in dLckCre;Rosa26mTmG mice bearing liver metastases. g, Representative ex vivo fluorescence image of a fresh liver metastasis section. mTomato (red) labels all liver and stromal cells; mGFP (green) marks T cells, where mGFP denotes membrane-targeted green fluorescent protein. Tumor glands indicated by solid lines lack fluorescence; metastasis edges are indicated by dashed lines. T cells localize to the stroma (arrowhead) or within tumor glands (triangle). Scale bar, 200 μm. h, Workflow schematic for ex vivo intratumoral T cell motility imaging. Fresh liver slices embedded in low-melting point agarose were sectioned (200 μm) and cultured in μ-Slide 8 Well chambers with Advanced DMEM/F12 medium (see the Methods for details). i, log ratio of T cells in tumor glands versus stroma per metastasis and per mouse. Large dots represent mouse averages; small dots represent individual metastases. Mice per group: vehicle (six mice, 38 metastases), anti-PD-L1 therapy (five mice, 34 metastases), galunisertib (three mice, 26 metastases), dual therapy (eight mice, 35 metastases). j, Representative T cell motility tracks from ex vivo imaging over 20 min. Color scale indicates mean speed (μm s−1). Scale bar, 200 μm. k, Distribution of T cell mean speed (μm s−1) for each treatment. Cell motility was classified as low or high based on thresholds derived from the average speed and the 95th percentile observed for all vehicle-treated cells (see the Methods for details). l, Percentage of high-motility T cells at incremental distances from the metastasis edge (0.01-μm steps) toward the tumor core. Dot size reflects the number of metastases (mets) analyzed at each distance (same n values as in those in i). Mean ± s.d. For every distance (anti-PD-L1 therapy, galunisertib and dual therapy), cell activity was compared to that of the vehicle group by fitting a mixed linear model. Statistical significance (P ≤ 0.05) indicates the closest distance from the edge with a treatment effect compared to the vehicle, determined by mixed linear models. Box plots display median and interquartile range, and whiskers extend to minimum and maximum values. All statistical tests were two sided and corrected for multiple comparisons when applicable. Statistical analyses included a generalized linear model with a negative binomial family (a, metastasis number), a linear model with log transformation (a, CD3+ quantification), a linear model with experiment as the covariate (c) and a linear mixed-effect model with Dunnett’s multiple-comparison test (i). Arrowheads indicate T cells. Panels a, f and h were generated with BioRender.com.
- Blocking immune entry TGF-β prevents enough tumour-fighting T cells from exiting the bloodstream and entering metastatic tumours.
- Suppressing immune expansion inside tumours For the few T cells that manage to infiltrate the tumour, TGF-β reprograms macrophages to produce osteopontin, a protein that slows T-cell proliferation and dampens their activity.